Enhance Engagement with These 8 Innovative Infographic Design Concepts
In the realm of data presentation, infographics have emerged as a powerful tool, making complex information accessible and engaging. One key component that sets infographics apart is illustrations.
Illustrations, such as icons and graphics, play a crucial role in creating memorable infographics. They serve to evoke emotions, create a connection with the viewer, and provide context to the information being presented. Whether it's a simple line chart showing data as multiple points connected by straight lines, or a pie chart effectively comparing a few data points, especially when data is presented as percentages, illustrations are the backbone of infographic design.
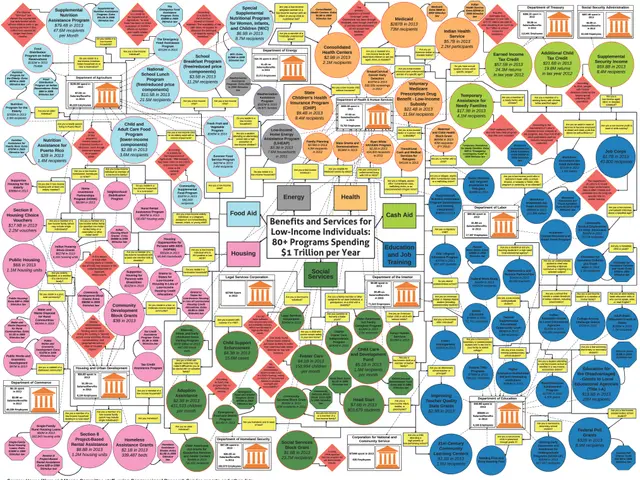
Flowcharts, for instance, depict the steps of a process or system, using shapes and arrows to guide the flow of information. They are invaluable in breaking down complex processes into manageable, understandable parts. Similarly, maps in infographics can visualize facts ranging from population density to climate patterns, bringing spatial data to life.
Timelines, on the other hand, show events that have happened at different points in time, visualizing historical events, migration patterns, trade routes, or any other data that involves time. Bubble charts let you present data with multiple variables or compare clusters of information, adding another layer of depth to your infographic.
The Infographic Maker platform, developed by Venngage, offers a suite of tools to help you create stunning infographics. With features like the drag-and-drop interface, users can easily add, remove, and swap elements. The platform also provides thousands of infographic templates to kickstart your design process.
Moreover, the My Brand Kit feature allows users to save their brand colours, ensuring consistency across all infographics. The platform also offers royalty-free stock images and illustrations, customizable icons, and branding options (available in the paid plan).
Well-designed illustrations can make an infographic memorable and help readers retain the information. They are focused on reinforcing key ideas, creating a visual hierarchy, and staying on topic to improve retention and understanding of the infographic's message.
In conclusion, the strategic use of illustrations in infographics can transform complex data into visually enticing, easy-to-understand, and memorable presentations. With Venngage's Infographic Maker, creating such infographics is now within everyone's reach.
Read also:
- Peptide YY (PYY): Exploring its Role in Appetite Suppression, Intestinal Health, and Cognitive Links
- Toddler Health: Rotavirus Signs, Origins, and Potential Complications
- Digestive issues and heart discomfort: Root causes and associated health conditions
- House Infernos: Deadly Hazards Surpassing the Flames


